
Introducing Measurement
 In quantitative research, measurement allows for the discovery of the primary data upon which all statistical analysis rests. In this installment, the link betweeen the activity of measurement and the thing measured is explained.
Measurement is a fundamental concept in all quantitative research, whether involving the study of the physical world, health and medicine, economics, human behavior, or social phenomena. Measurement can be defined as the assigning of numbers, or in some cases labels, to objects being studied in order to represent characteristics of those objects. By assigning numbers corresponding to those characteristics, researchers generate the raw information, which in turn, facilitates more in-depth statistical analysis. Although both statistics and measurement involve assigning values to the properties of objects and constructs, measurement provides the primary data to which statistical tools can be applied.
Begining with a Definition of the Object of Measurement
Before any measurement can take place, before any instrument can be put into action, the thing being measured must be defined. Conceptually speaking, measurement in the physical sciences allows for its most straightforward application. One reason for this is that objects and their characteristics are easily defined. Measuring the velocity of objects in our everyday world, for instance, begins with a simple mathematical definition—distance over time. Other properties of physical objects, such as mass, density, length, height, force, acceleration, work, frequency—to name a few—are typically tangible and therefore easily defined.
However, when analyzing social or psychological variables concepts are often abstract. Take leadership style, for example. A person wishing to study the variable “leadership style” will most likely spend a great deal of time defining such a construct. Unlike an object, which has physical properties, leadership style is a way of doing something rather than a thing. Further, there are various ways to view leadership--from the perspective of personality, behavior, communication, and organizational results. So not only is leadership a way of doing something but its meaning changes depending on how the researcher approaches the concept. In general, due to this level abstraction, researchers must take great care in how they define their constructs before they measure them. Other variables may be abstract but easily defined, such as economic indexes and rates, per capita frequencies, cases, and counts. The interest rate is an example of a variable that is easily defined but does not refer to a physical property of an object.
Only when the definition of the construct and its properties is established can measurement occur. Because measurement is a quantifying act, the term construct or one of its aspects can be discussed as a variable. Developing a sound definition, however, is only the first step. In order to measure a variable, one needs an instrument.
Instruments and Measurement
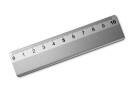
Measurements are obtained through the application of instruments, there being no measurement without them. If you wish to know the length of a piece of cloth, you use a ruler. If you want to discover the temperature outside, you consult a thermometer. If you are monitoring your own body weight, you step on a scale. All of these instruments yield data about objects or phenomena in the world.
In the field of behavioral and social research, the fit between instruments, things measured, and the data obtained is not as simple as the examples above. Researchers must take great care in developing the instruments in order to make sure they accurately measure the constructs for which they are designed. A common type of instrument is a survey or questionnaire instrument, very popular in pscychometric research. With a survey instrument, questions are worded so that they measure an underlying concept/construct. Subjects’ responses are typically either in numerical form (e.g. Likert-scale) or their qualitative responses can be converted to a numerical code.
Unlike the case of a ruler, a thermometer, or a scale, the correspondence between instrument, object, and the data cannot be assumed. Rather, that correspondence must be justified. A great deal has been written about how one should go about justifying the correspondence, typically headed under the subject of the validity and reliability of instruments. There exist different types of validity and reliability which is beyond the scope of this article.
Levels of Measurement
Although measurement and statistics are not equivalent, it is important that the level of measurement be understood and identified as this can have important consequences for the type of statistical techniques applied to the data. There are four levels of measurement, each providing increasing amounts of information.
1. The nominal level provides the least amount of information. Nominal level data describes the nature or category of the data. Some examples of nominal level data include whether someone is male or female, colors of an object, failure or success on a task, type of vehicle (e.g., sedan, truck, wagon), and so forth. There is no intrinsic numerical quality to nominal characteristics. In order to apply statistical techniques to nominal level data, the data must be transformed into a code. For instance, success and failure on a task might be coded 1 and 0, respectively.
2. The next level is ordinal. With ordinal level data, the characteristics of something have numerical value only in relation to each other and only in terms of rank or degree. A good example or ordinal level data would be the simple ranking of participants in a baking contest by a single judge. Values 1, 2, and 3 corresponding to the first, second, and third place winners have meaning in relation to each other but no specific quantity can be assigned to ranks, nor does it make sense to talk about numerical differences, other than ranks, between participants.
3. The third level is interval. Unlike ordinal data, numerical differences between ranks make sense. In the baking contest example, if the judge based her score on a scale of 1 to 10, 1 being of poor quality and 10 being excellent, differences between first, second, and third places winners would gain a level of precision not revealed by ordinal level data. Thus, if the 1st place winner received a score of 9 from the judge and the second place winner received a score of 3, we would know the difference in rank is significant. With ordinal level rankings we would only know that the judge valued the creation of the 1st place winner to some extent more than the 2nd place winner. Without reference to a point system, in this example, we would not know how much more the judge liked the 1st place creation. With interval results, we know it was not a close call—the judge really liked the 1st place winner’s creation when compared to the second place winner’s creation.
4. While a great deal of information is revealed through interval level data, ratio level data provides even more information. In the ranking of participants in a baking contest, differences were meaningful. However, did the judge like the 1st place winner’s banana bread three times more than the 2nd place winner’s pumpkin bread? With interval level data, division and multiplication are not possible. Interval level data does not allow one to conclude the first place winner’s creation was three times better than the 2nd place winner’s creation. Ratio-level measurement, because it has an absolute zero, allows for division and multiplication. Income, for example, has an absolute zero, meaning it is possible to have no income (represented as zero dollars). Thus statements such as, “I made twice as much as I did last year,” or “People in country PDQ, make one third of what people make in country XYZ,” are possible.